College football stat graphics, built from every play.
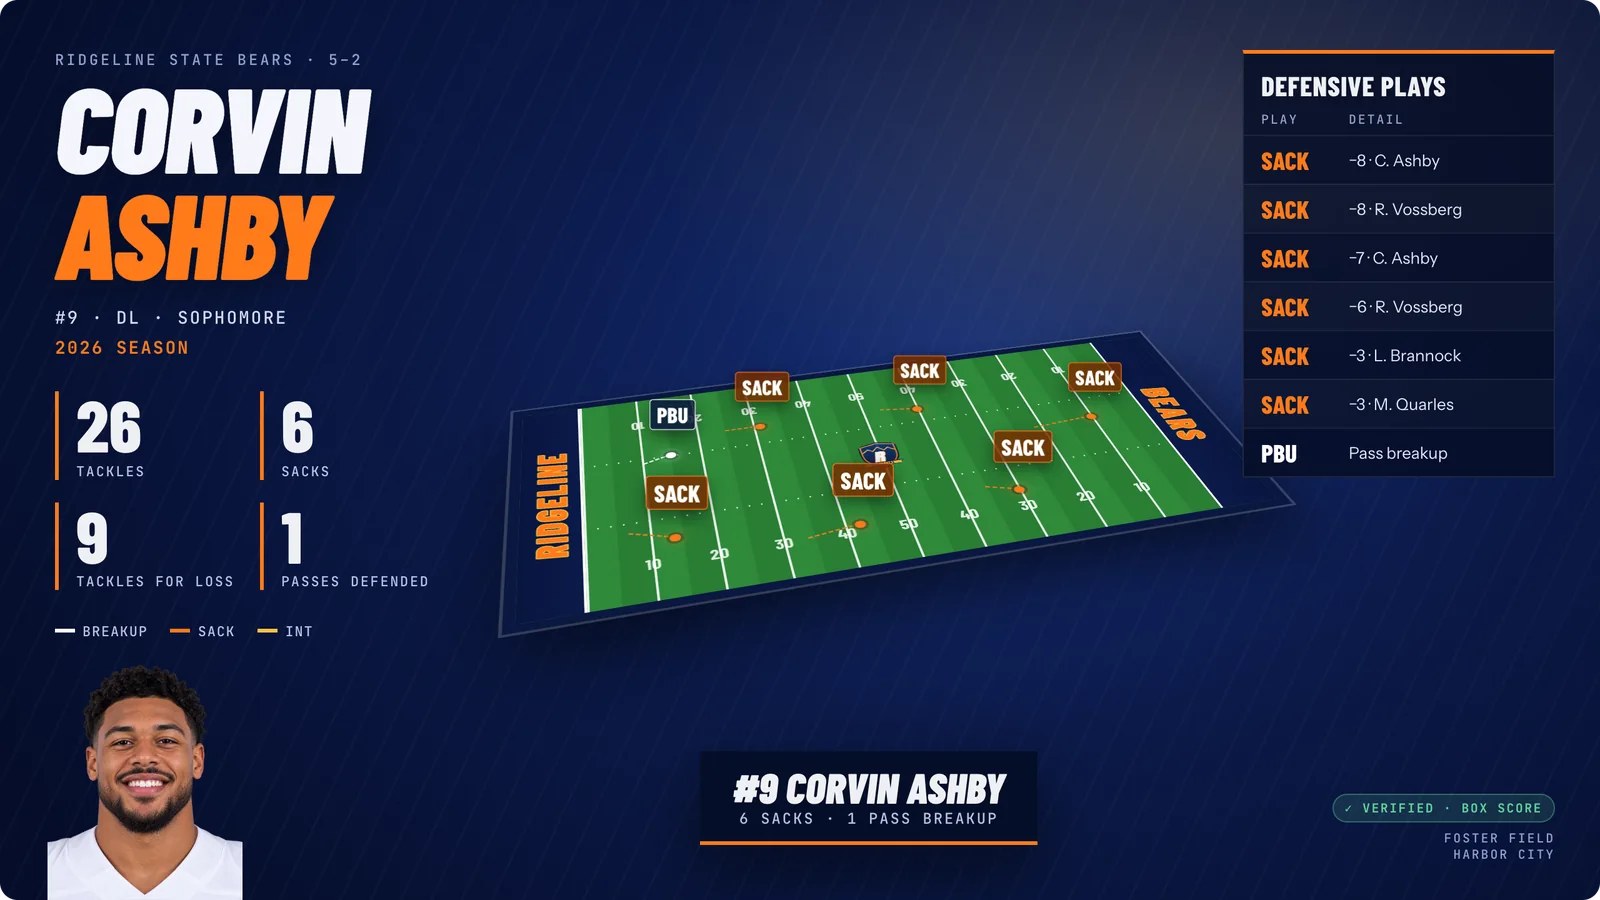
HighlightStats is stat graphics software for college football communications offices. Pick a player and a stat, and it draws every play on a 3D field from the play-by-play, in your colors, then exports a 1080p video or a still that’s checked against the box score.
Every graphic a football season needs
Where HighlightStats helps
No numbers typed by hand
- 1Pick a player and a statBig plays, touchdowns, deep shots, returns, third downs, red zone, defense, field goals or a game recap.
- 2The plays are drawn and checkedEvery play is placed from the play-by-play, and the totals are checked against the box score.
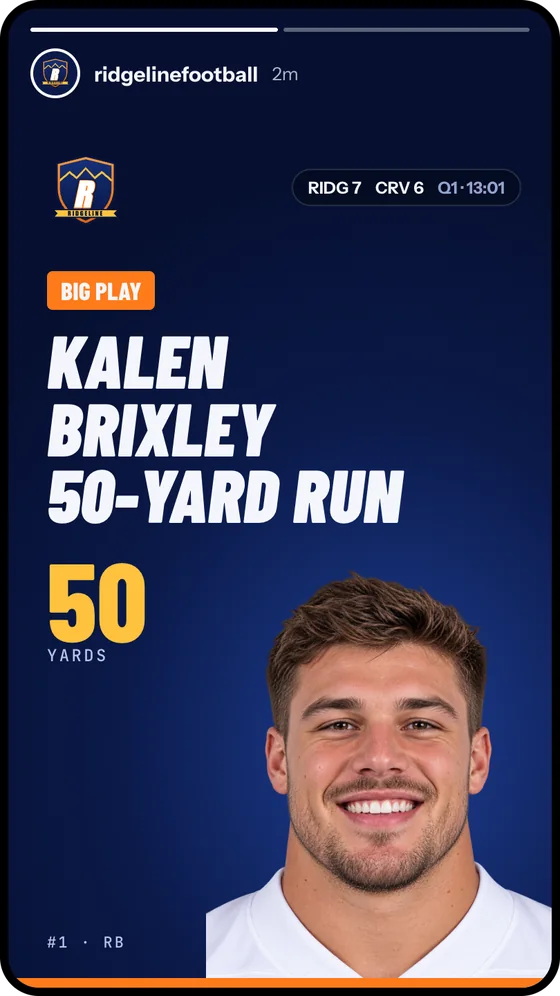
- 3Export and shareDownload a 1080p MP4 or a still, then make the 4:5 and 9:16 versions with a caption.
Questions, answered
A short video that draws a player’s or team’s plays on the field, showing where each one started and ended, with the totals beside it. HighlightStats makes them from the play-by-play, so the drawing and the numbers match the game.
With templates, someone types every number into a design. HighlightStats builds the graphic from the game’s plays, checks the totals against the box score, and makes every size at once.
A 1920×1080 MP4 or still, plus 4:5 (1080×1350) and 9:16 (1080×1920) versions for feeds and stories.
College football, FBS and FCS.
See it with your team
We’ll load your colors, stadium and roster, then make a real graphic from your last game on the call.
Request a demo →